
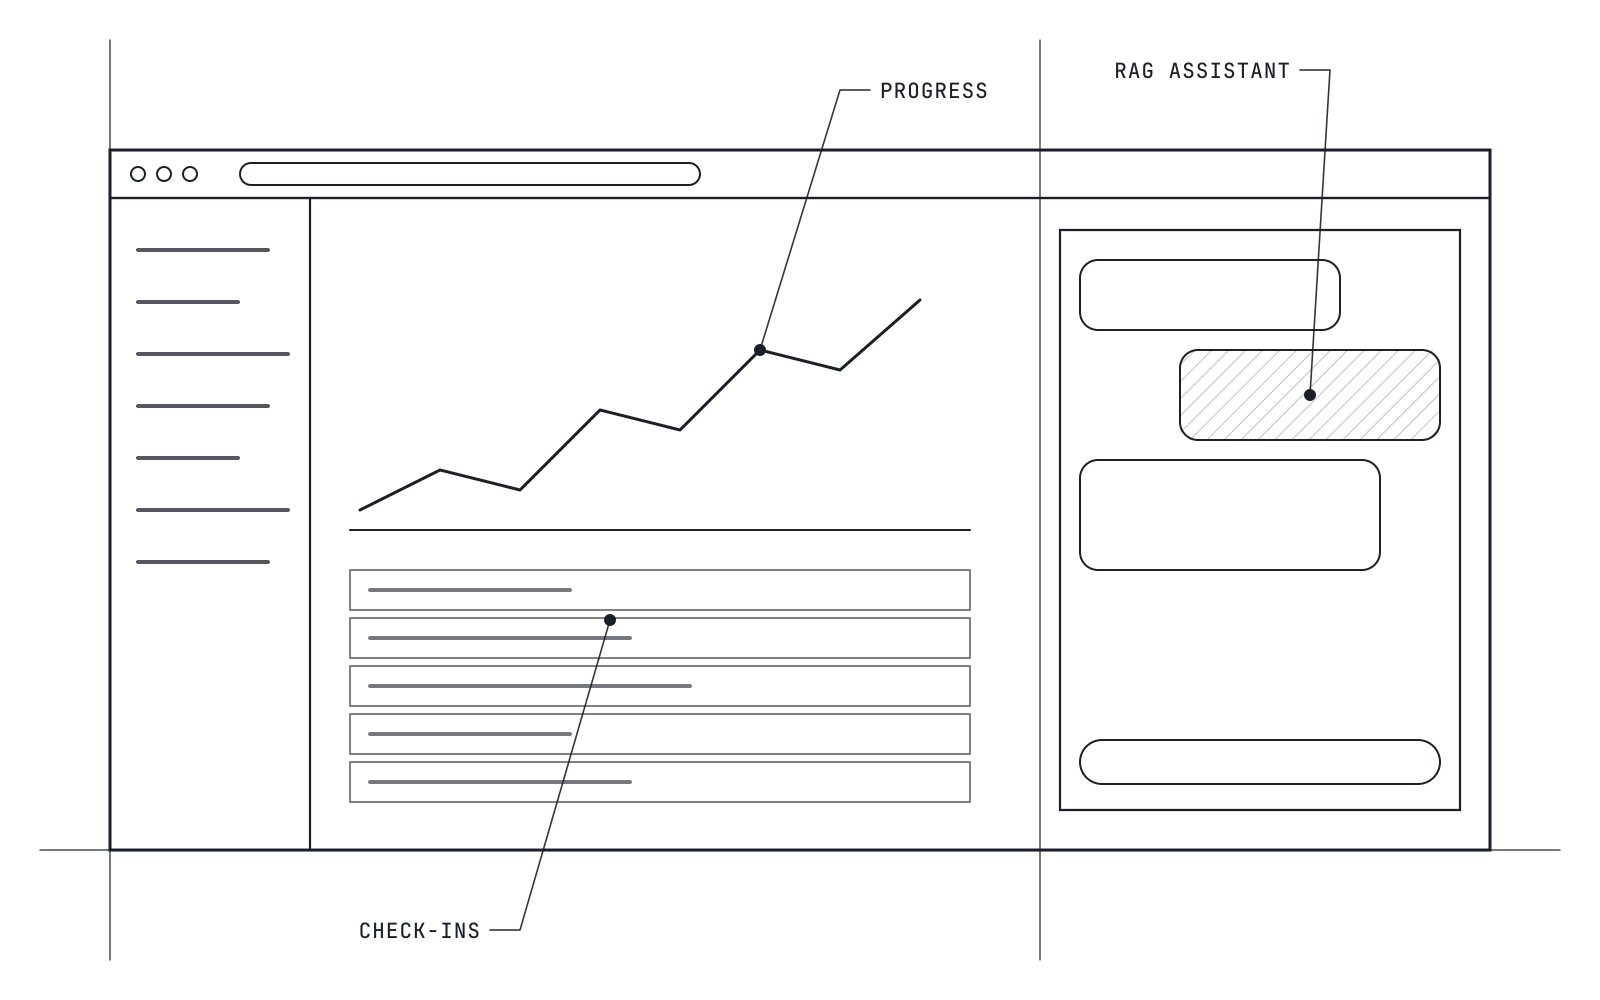
AI coaching platform for sports coaches
AI & SaaS. An assistant that answers athletes in their coach's own style, around the clock.
Read the case studySheet
S-104
Studio
Digital Forge
You can't see how the business is doing without asking someone to pull a report.
AI & SaaS. An assistant that answers athletes in their coach's own style, around the clock.
Read the case study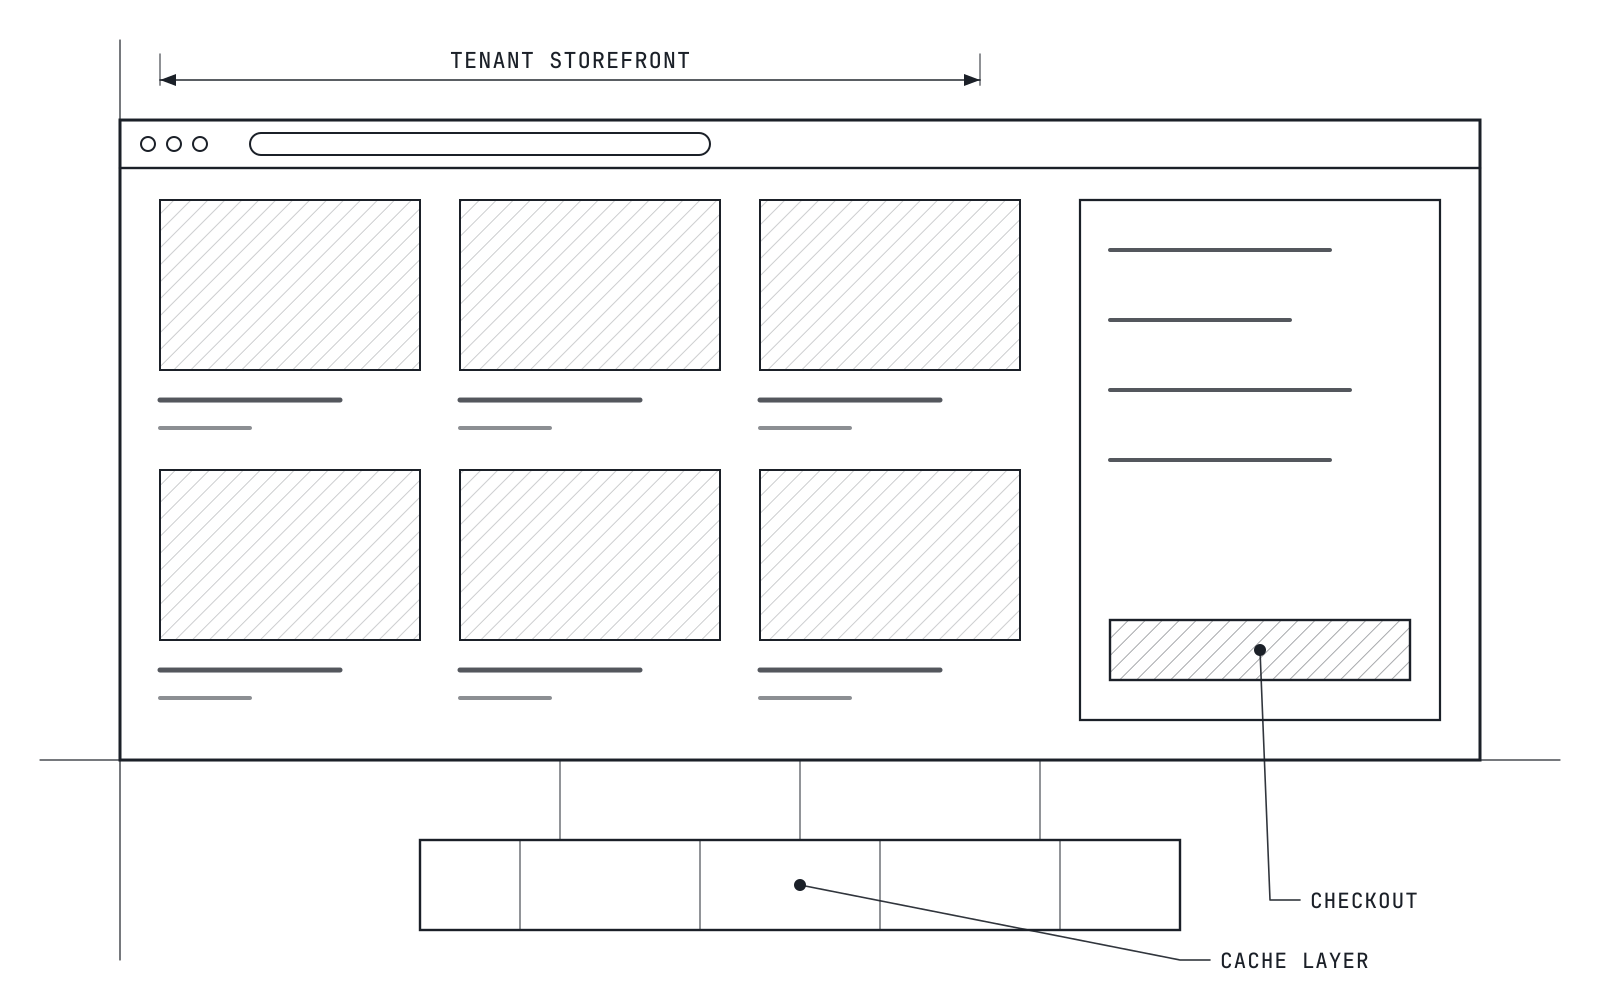
E-commerce. Many sellers, one shared platform, each with its own storefront.
40%faster platform
Read the case studyUsually, yes. Most business tools export data or offer an API, and we build the pipeline that pulls it together.